Introduction to pipelines and jobs
Introduced in GitLab 8.8.
Pipelines
A pipeline is a group of jobs that get executed in stages(batches). All of the jobs in a stage are executed in parallel (if there are enough concurrent Runners), and if they all succeed, the pipeline moves on to the next stage. If one of the jobs fails, the next stage is not (usually) executed. You can access the pipelines page in your project's Pipelines tab.
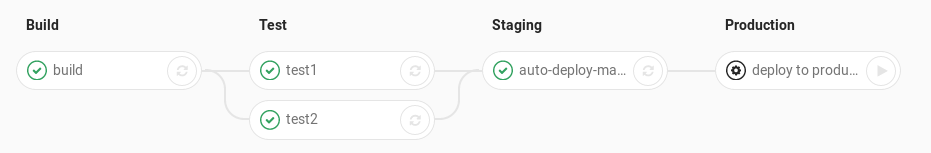
In the following image you can see that the pipeline consists of four stages
(build, test, staging, production) each one having one or more jobs.
Note: GitLab capitalizes the stages' names when shown in the pipeline graphs.
Types of pipelines
There are three types of pipelines that often use the single shorthand of "pipeline". People often talk about them as if each one is "the" pipeline, but really, they're just pieces of a single, comprehensive pipeline.

-
CI Pipeline: Build and test stages defined in
.gitlab-ci.yml -
Deploy Pipeline: Deploy stage(s) defined in
.gitlab-ci.ymlThe flow of deploying code to servers through various stages: e.g. development to staging to production - Project Pipeline: Cross-project CI dependencies triggered via API, particularly for micro-services, but also for complicated build dependencies: e.g. api -> front-end, ce/ee -> omnibus.
Development workflows
Pipelines accommodate several development workflows:
- Branch Flow (e.g. different branch for dev, qa, staging, production)
- Trunk-based Flow (e.g. feature branches and single master branch, possibly with tags for releases)
- Fork-based Flow (e.g. merge requests come from forks)
Example continuous delivery flow:

Jobs
Jobs can be defined in the .gitlab-ci.yml file. Not to be
confused with a build job or build stage.
Defining pipelines
Pipelines are defined in .gitlab-ci.yml by specifying jobs that run in
stages.
See the reference documentation for jobs.
Seeing pipeline status
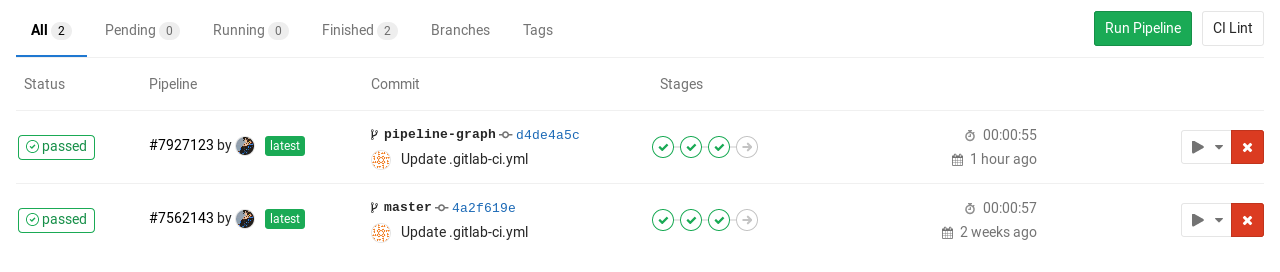
You can find the current and historical pipeline runs under your project's Pipelines tab. Clicking on a pipeline will show the jobs that were run for that pipeline.
Seeing job status
When you visit a single pipeline you can see the related jobs for that pipeline. Clicking on an individual job will show you its job trace, and allow you to cancel the job, retry it, or erase the job trace.
Pipeline graphs
Introduced in GitLab 8.11.
Pipelines can be complex structures with many sequential and parallel jobs. To make it a little easier to see what is going on, you can view a graph of a single pipeline and its status.
A pipeline graph can be shown in two different ways depending on what page you are on.
The regular pipeline graph that shows the names of the jobs of each stage can be found when you are on a single pipeline page.
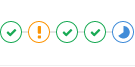
Then, there is the pipeline mini graph which takes less space and can give you a quick glance if all jobs pass or something failed. The pipeline mini graph can be found when you visit:
- the pipelines index page
- a single commit page
- a merge request page
That way, you can see all related jobs for a single commit and the net result of each stage of your pipeline. This allows you to quickly see what failed and fix it. Stages in pipeline mini graphs are collapsible. Hover your mouse over them and click to expand their jobs.
| Mini graph | Mini graph expanded |
|---|---|
 |
 |
Grouping similar jobs in the pipeline graph
Introduced in GitLab 8.12.
If you have many similar jobs, your pipeline graph becomes very long and hard to read. For that reason, similar jobs can automatically be grouped together. If the job names are formatted in certain ways, they will be collapsed into a single group in regular pipeline graphs (not the mini graphs). You'll know when a pipeline has grouped jobs if you don't see the retry or cancel button inside them. Hovering over them will show the number of grouped jobs. Click to expand them.
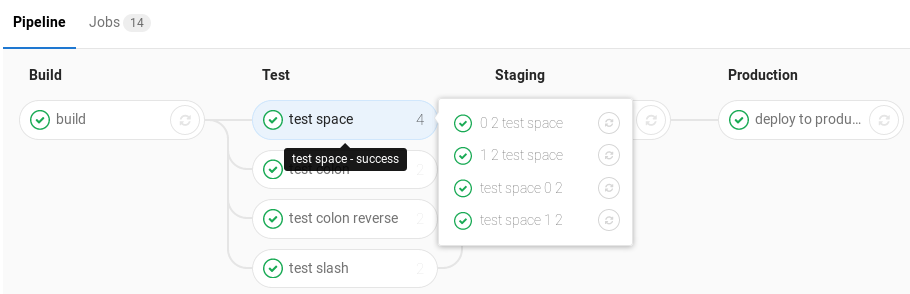
The basic requirements is that there are two numbers separated with one of the following (you can even use them interchangeably):
- a space
- a backslash (
/) - a colon (
:)
Note: More specifically, it uses this regular expression:
\d+[\s:\/\\]+\d+\s*.
The jobs will be ordered by comparing those two numbers from left to right. You usually want the first to be the index and the second the total.
For example, the following jobs will be grouped under a job named test:
-
test 0 3=>test -
test 1 3=>test -
test 2 3=>test
The following jobs will be grouped under a job named test ruby:
-
test 1:2 ruby=>test ruby -
test 2:2 ruby=>test ruby
The following jobs will be grouped under a job named test ruby as well:
-
1/3 test ruby=>test ruby -
2/3 test ruby=>test ruby -
3/3 test ruby=>test ruby
Manual actions from the pipeline graph
Introduced in GitLab 8.15.
Manual actions allow you to require manual interaction before moving forward with a particular job in CI. Your entire pipeline can run automatically, but the actual deploy to production will require a click.
You can do this straight from the pipeline graph. Just click on the play button
to execute that particular job. For example, in the image below, the production
stage has a job with a manual action.
Ordering of jobs in pipeline graphs
Regular pipeline graph
In the single pipeline page, jobs are sorted by name.
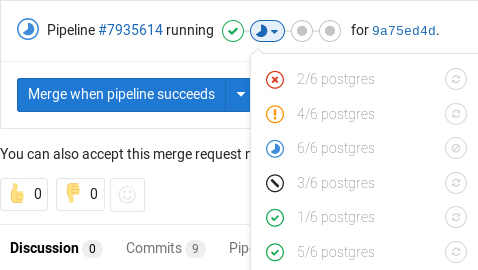
Mini pipeline graph
Introduced in GitLab 9.0.
In the pipeline mini graphs, the jobs are sorted first by severity and then by name. The order of severity is:
- failed
- warning
- pending
- running
- manual
- canceled
- success
- skipped
- created
How the pipeline duration is calculated
Total running time for a given pipeline would exclude retries and pending (queue) time. We could reduce this problem down to finding the union of periods.
So each job would be represented as a Period, which consists of
Period#first as when the job started and Period#last as when the
job was finished. A simple example here would be:
- A (1, 3)
- B (2, 4)
- C (6, 7)
Here A begins from 1, and ends to 3. B begins from 2, and ends to 4. C begins from 6, and ends to 7. Visually it could be viewed as:
0  1  2  3  4  5  6  7
   AAAAAAA
      BBBBBBB
                  CCCC
The union of A, B, and C would be (1, 4) and (6, 7), therefore the total running time should be:
(4 - 1) + (7 - 6) => 4Badges
Pipeline status and test coverage report badges are available. You can find their respective link in the Pipelines settings page.